Smoke Impact Summary #3 Soberanes Wildfire
Air Basin: North Center Coast CAL
Fire IMT 4 w/ USFS
Issued for July 31st, 2016 Prepared by:Gary M. Curcio
Time: 5:25 PM Air Resource Advisor
Fire Status & Key Points:
1.
Fire
has burned approximately 38,007 acres
as of 7/31/16.
2.
Yesterday
the fire increased in size by approximately 4,435 acres.
3. The expected growth for today is
4,000 acres.
|
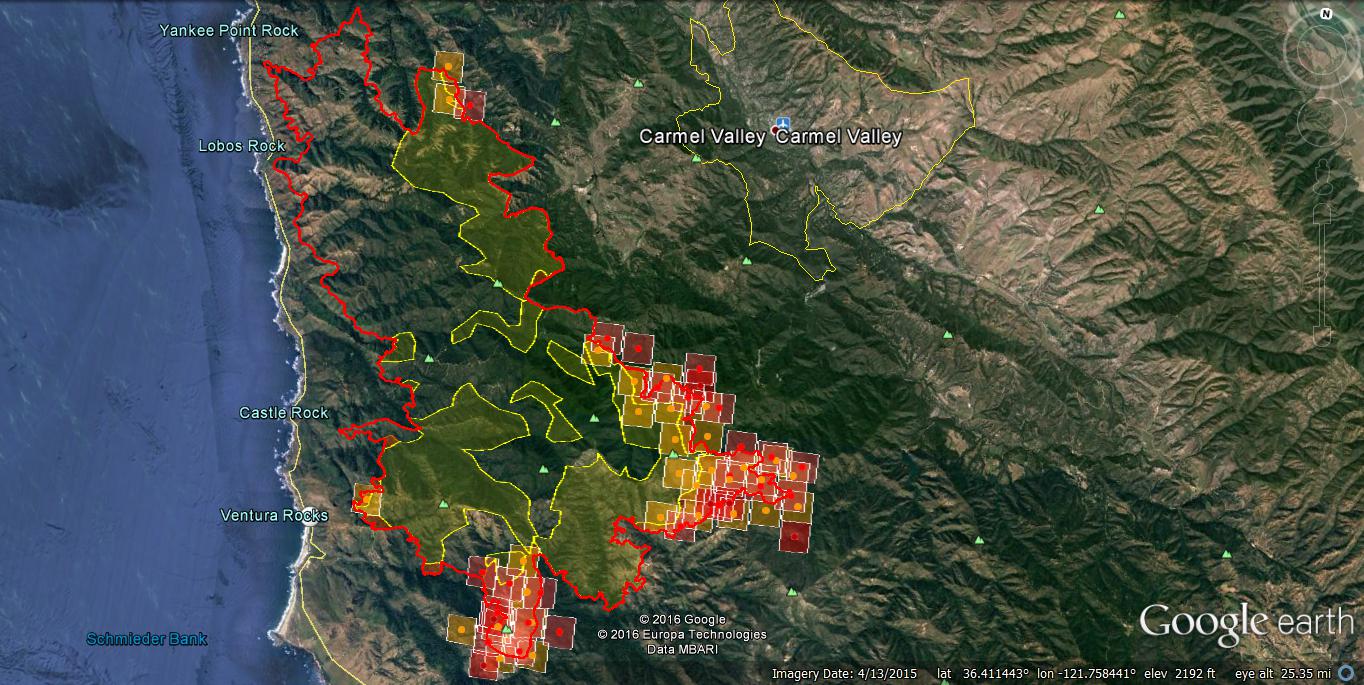
Photo: Sunday 7/31 at 2:00 PM PDT. Infra-red fire
perimeter & MODIS heat signatures identify active burning on the fire’s
east side. This E/SE side of the fire is where fire growth continues to
occur and is the main emission source impacting Carmel Valley and Salinas
Valley communities.
The red heat
signatures are 0 – 12 hours old. The orange heat signatures are 12 – 24
hours old. They both reside in the areas of intense heat identified by the
IR Flight.
 |
|
Photo: IR Flight from last night July 30th identifying
areas of intense heat (red
shading & white arrows) and scattered
heat (yellow shading). These areas are the main areas for the origin of
smoke production as well as various points of isolated heat. New fire
growth continues on the SE / S sides of the fire. Being this close to smoke
emissions local communities are being ephemerally affected. Air Quality
vacillates through the course of the day as the Marine Layer retreats and
natural up valley winds sweep clean air into local valleys.
|
4.
The extent of smoke
production and its long range drift displays merging plumes of fires in other
states. Sobranes Fire smoke comes from variours sources but a large
contribution will come from a planned burnout to begin on Monday and continues
on Tuesday. This is always subject to
change based on fire behavior, weather and progress made along the fireline in
preparation for the burnout. The wind pattern still remains S/SW. Soberanes
smoke plume continues to press to the N/NE with some smoke at lower levels
being siphoned off by valley winds from the Carmel and Salinas Valleys.

|
Photo: NOAA Hazard Mapping System-July 30th quantifies
three layers of smoke:
1.Green = light , 2.Yellow = medium &
3.Red = dense (not shown). These layers are not defined by
the elevation above ground. However, they do provide valuable information
concerning the horizontal extent of the smoke plume or zone of influence.
|
5. AQ monitors are providing observations for the
fire’s Smoke Impact Forecast and AQ Outlook Table. This can be used for planning
personal activities. Each station’s AQI information is being provided on what
was observed yesterday. This provides a reference point when forecasting AQ Today
and Tomorrow values. Carmel River was “Very Unheathy” at 6 AM while Carmel
Valley was trending “Unheathy” at 9 & 10 AM. Hollister which was rated for
the day yesterday at “Moderate”, was tracking at “Unhealthy for Sensitive
Groups” by 10 AM. It is not expected that these AQI levels will be maintained
through the 24 hour sampling period.


6.
Photos
above: Captured by satellite imagery for
the second second straight day is the Marine layer advance and its association with Soberanes
smoke plume. Its full SE advance and retreat was completed by 10:30 AM. Comparing this to yesterday, took 2 hours
longer to complete.
7.
The marine layer / inversion will continue to wall off the
wildfire’s smoke that is above the marine layer. This higher level smoke is
making its way to the San Joaquin Valley and Sierra Foothill. With the burnout
planned for tomorrow, we expect greater impact to the San Joaquin Valley and
Sierra Foothills. The marine layer also caps wildfire smoke that is under the
inversion. This smoke below the inversion is being lifted but only to the
bottom of the inversion. This facilitates better air quality at the surface for
impacted communities.
8.
The positive point of wildfire smoke continues. The “Smoke
Veil” when present provides a shading
effect. Thus generating a cooling effect on forest fuels and air temperature. This
decrease in temperature ever so slightly
moderates fire behavior and thus continues to aid the suppression effort.
No comments:
Post a Comment